
Princess Amalia offshore wind farm
A comprehensive collection of operational data from the 120 MW Princess Amalia offshore wind farm has been made available for use by the scientific community. The dataset covers the period from 2008 to 2017 and includes meteorological data, power data, and control variables from all 60 wind turbines.
The dataset is hosted by TNO and is freely available under a CC BY 4.0 license.
Introduction
The wind energy industry has always relied heavily on numerical models developed by academia. From wakes to grid integration, these models help the industry to design more cost-effective wind farms, reduce the uncertainty around financial returns, and realize the large-scale build-out we see today. Yet, their accuracy and robustness depend on validation against real-world operational data — data that is often locked within companies due to confidentiality constraints, commercial interests, and/or fear of the unknown when data is released. Although data exchanges do take place, they are most often in the bigger research projects with industry support, which tend to focus on a higher technology readiness and can take years from the initial idea to the point where the data is accessible to academics. And even then, non-disclosure agreements and restrictions on the publication format make it difficult for the scientific community to replicate and cross-check results.
To foster scientific advancements and promote open dialogue, Eneco is publishing the first decade of operational data of the Princess Amalia wind farm under a CC BY 4.0 license. To our knowledge, this is among the longest publicly available wind farm SCADA datasets with a length similar to the Hill of Towie onshore wind farm dataset. By making it readily accessible, we hope that it may also support exploration studies (that are difficult to capture under the scope of non-disclosure agreements) and shorter duration research topics (such as graduation projects).
Wind farm description
The Princess Amalia wind farm (Dutch: Prinses Amaliawindpark; abbr. PAWP) is the second Dutch offshore wind farm and the first Dutch offshore wind farm to be constructed outside the twelve nautical mile zone. It is located about 24 km off the coast of IJmuiden in the Q7 mining block, from which it owes its former name Offshore Windpark Q7. Foundation installation started in October 2006, followed by wind turbine installation in September 2007. The wind farm was officially opened on 4 June 2008. It received a feed-in tariff of 97 €/MWh under the MEP scheme (Ministeriële regeling milieukwaliteit elektriciteitsproductie) during the first ten years. The Princess Amalia wind farm has been wholly owned by Eneco since 2011.
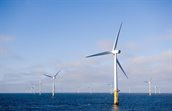
PAWP has a total capacity of 120 MW, consisting of 60 x Vestas V80-2.0 MW on a monopile foundation. The wind turbines have a diameter of 80 m and a hub height of 59 m above mean sea level (MSL). They are positioned in a hexagonal grid pattern and connected to the offshore high voltage station by eight 22-kV strings. The 150-kV export cable lands just south of Wijk aan Zee and follows a land route until it connects to the Velsen high-voltage station. The water depth at the site ranges from 19 to 24 m beneath the lowest astronomical tide (LAT). The difference between MSL and LAT is approximately 1.1 m.
There are two neighboring windfarms in the direct vicinity of PAWP. One is located some 13 km to the east: the Offshore Windpark Egmond aan Zee (OWEZ), which was commissioned in January 2007. A second wind farm, Eneco Luchterduinen (LUD), is situated 20 km to the south and was opened in September 2015.
The mean wind speed at hub height is around 9 m/s and is dominant from the southwest. During the ten years that this dataset spans, there have been several metocean campaigns in the vicinity of PAWP that may support the analysis. Data from these campaigns is available from TNO and the Netherlands Enterprise Agency. These include two offshore met masts: the OWEZ Meteorological Mast (July 2005 to December 2010) and MeteoMast IJmuiden (November 2011 to March 2016), which are 10 and 60 km away, respectively. In addition, two sets of floating lidars have been active to support the Hollandse Kust tenders: HKZ-A/B (June 2016 to June 2018) at a 35-km distance and HKN-A/B (April 2017 to April 2019) at a 10-km distance. Finally, at a distance of 80 to 100 km, several permanent vertical lidars have been in operation on Lichteiland Goeree (since November 2014), Europlatform (since Jul 2016), and K13-A (since November 2016).
For high-quality reanalysis data of the area, we refer the reader to the Dutch Offshore Wind Atlas and its expansion in the WINS50 project. The data is available as hourly or daily time series per grid point, or as slices, and is hosted at the KNMI Data Platform. Together, these cover the period from 2007 to 2021, ranging from 10 to 600-m height at a 2.5-km horizontal resolution.
A lot of environmental research has been carried out in the first operational years to support model calculations in the pre-construction environmental impact assessment. Most of them focused on the development of benthic fauna on the seafloor in and around PAWP, since the wind farm area is closed off from bottom trawling. Related to this were studies on the fish stock, seafloor morphology, hard substrate fauna, underwater noise, and the potential impact of electromagnetic fields. In addition, PAWP housed two bat detector systems that served as input for the bat migration study. Finally, there have been studies on vessel movements, radar disturbance, and visibility from shore.
Scope
The PAWP dataset spans from the moment of first power (6 Jan 2008) until the end of the subsidy period (31 December 2017). The data is sampled from the supervisory control and data acquisition (SCADA) system in ten-minute intervals and for all sixty turbines.
Most of the signals originate from the turbines and cover wind measurements, power production, and control actions for each of the 60 turbines. All variables contain the ten-minute mean value. For the blade pitch, generator speed, rotor speed, power, and wind speed signals, the minimum, maximum, and standard deviations are included as well. Next to the turbine signals, we also included the significant wave height and maximum wave height measured by a Radac Waveguide radar looking down from the offshore substation. These measurements are logged as one-minute means and are only included from September 2011 onwards.
| Variable | Source | Description | Statistics | Frequency | Unit | Type | Precision | Typical range |
| Ambient temperature | Turbines | Measured underneath the nacelle at the rear escape hatch | Mean | 10 min | °C | Float | 1 °C | −10 to 30 |
| Blade pitch angle | Turbines | As measured by the pitch drive | Mean, min, max, std | 10 min | ° | Float | 0.1° | -5 to 93 |
| First alarm in 10 min frame | Turbines | Contains alarm codes | First | 10 min | Integer | 1 | 0 to 922 | |
| Generator speed | Turbines | Measured on the high-speed shaft | Mean, min, max, std | 10 min | rpm | Float | 1 rpm | 0 to 1680 |
| Nacelle direction | Turbines | From the yaw drives | Mean | 10 min | ° | Float | 0.1° | 0 top 360 |
| Nacelle temperature | Turbines | Measured underneath the nacelle at the rear escape hatch | Mean | 10 min | °C | Float | 1 °C | -15 to 35 |
| Operating state | Turbines | Mean | 10 min | Integer | 1 | 0 to 5 | ||
| Power | Turbines | Active power measured at the converter | Mean, min, max, std | 10 min | kW | Float | 0.1 kW | -10 to 2000 |
| Rotor speed | Turbines | Measured on the low-speed shaft | Mean, min, max, std | 10 min | rpm | Float | 0.1 rpm | 0 to 18 |
| Spinner temperature | Turbines | Measured at the spinner cabinet inside the nose cone | Mean | 10 min | °C | Float | 1 °C | 0 to 30 |
| Wave height | Substation | Significant and maximum wave height from the radar mounted on a railing on the substation | 33%ile, max | 1 min | m | Float | 10−9 m | 0.2 to 8 |
| Wind direction | Turbines | Combined from the sonic anemometer and the nacelle position | Mean | 10 min | ° | Float | 0.1° | 0 to 360 |
| Wind speed | Turbines | Measured at the rear of the nacelle and processed by a transfer | Mean, min, max, std | 10 min | m s−1 | Float | 0.1 m s−1 | 0 to 30 |
File structure
The data is saved as comma-separated values (CSV) with a separate file for each variable. A header text containing the column names is included in the first line. Each file spans the released data period and contains 61 columns, with column 1 containing the time stamps in Coordinated Universal Time (UTC) and columns 2–61 containing the values for the turbines G001 through G060. In case of the wave data, there are only two columns: the time stamps and the wave heights. The full set covers 29 files and totals to around 3.8 GB.
Data quality
The data has been retrieved from the raw sensor readings and processed by the onboard turbine controller. The instantaneous high-frequency data was then and aggregated into ten-minute statistics through VestasOnline Business. A ten-minute data point covers the interval prior to the recorded time stamp; e.g., the value at 12:00 represents the statistics over 11:50 to 12:00.
Missing data is denoted with “NaN”. These instances indicate a loss of communication, which can be due to loss of power or a fault in the connecting network. Most often, missing data periods coincide with turbine errors or maintenance actions. The turbine signals have a 95.8% data availability. The significant wave height and maximum wave height amounted to 70.6% and 67.3%, respectively, although it must be noted that this was an experimental setup.
When doing performance analyses, please note that a controller update was rolled out on 8 October 2015. As a result, the cut-in behavior, power, and thrust characteristics are different prior and after this date.
In the ten years that this dataset spans, PAWP has known three cable failures. The first fault occurred on 16 July 2010 and isolated turbine G041 until communication was restored on 1 June 2011. The second incident was between 28 November 2010 and 12 May 2011 and affected the turbines G031, G039, G040, G048, G049, and G056. The third only lasted between 23 June 2016 and 23 July 2016 and affected the turbines G014, G015, and G016. In addition, there have been several major component campaigns to exchange various drivetrain components, which may explain longer downtimes for individual turbines.
Conclusion
A comprehensive ten-year SCADA dataset of the Princess Amalia wind farm has been made public for the scientific community to use. The data period covers the subsidized operational period during which PAWP ran at high technical availability and in stable market conditions. Moreover, the dataset can be complemented with metocean measurements from nearby floating lidar buoys and high-quality reanalysis data from the Dutch Offshore Wind Atlas. As such, this provides an excellent opportunity to test out wake models, O&M models, and undoubtedly many other applications that we have not yet foreseen. The dataset has been made available through TNO and can be freely accessed after registering.
Data
To download the data from Princess Amalia Offshore Wind Farm (PAWP), you will be redirected to the registration page, after registration, the data is accessible.
Citation
Eneco. (2026). Ten years (2008-2017) of SCADA data from the Princess Amalia offshore wind farm: https://doi.org/10.82135/tno-1036183
Wind turbine coordinates
| Name | Latitude [° N] | Longitude [° E] | Easting [m] | Northing [m] |
| Substation | 52.58553 | 4.23536 | 583695 | 5826882 |
| G001 | 52.60457 | 4.24072 | 584022 | 5829007 |
| G002 | 52.60516 | 4.22669 | 583071 | 5829056 |
| G003 | 52.60240 | 4.23342 | 583532 | 5828757 |
| G004 | 52.59964 | 4.24016 | 583994 | 5828458 |
| G005 | 52.59689 | 4.24689 | 584455 | 5828159 |
| G006 | 52.60537 | 4.21240 | 582103 | 5829063 |
| G007 | 52.60269 | 4.21922 | 582570 | 5828772 |
| G008 | 52.60000 | 4.22604 | 583037 | 5828481 |
| G009 | 52.59732 | 4.23285 | 583503 | 5828191 |
| G010 | 52.59463 | 4.23967 | 583970 | 5827900 |
| G011 | 52.59194 | 4.24649 | 584437 | 5827608 |
| G012 | 52.58926 | 4.25330 | 584904 | 5827318 |
| G013 | 52.58657 | 4.26012 | 585371 | 5827027 |
| G014 | 52.60249 | 4.20467 | 581585 | 5828734 |
| G015 | 52.59989 | 4.21157 | 582057 | 5828452 |
| G016 | 52.59728 | 4.21847 | 582529 | 5828170 |
| G017 | 52.59167 | 4.22538 | 583002 | 5827888 |
| G018 | 52.59207 | 4.23227 | 583474 | 5827606 |
| G019 | 52.58945 | 4.23917 | 583946 | 5827323 |
| G020 | 52.58684 | 4.24606 | 584418 | 5827041 |
| G021 | 52.58424 | 4.25295 | 584890 | 5826759 |
| G022 | 52.58163 | 4.25985 | 585362 | 5826477 |
| G023 | 52.59943 | 4.19696 | 581068 | 5828385 |
| G024 | 52.59690 | 4.20393 | 581545 | 5828111 |
| G025 | 52.59438 | 4.21093 | 582024 | 5827839 |
| G026 | 52.59186 | 4.21789 | 582500 | 5827566 |
| G027 | 52.58933 | 4.22488 | 582978 | 5827293 |
| G028 | 52.58680 | 4.23185 | 583455 | 5827020 |
| G029 | 52.58428 | 4.23882 | 583932 | 5826747 |
| G030 | 52.58174 | 4.24580 | 584410 | 5826473 |
| G031 | 52.57921 | 4.25277 | 584887 | 5826200 |
| G032 | 52.59385 | 4.20345 | 581041 | 5827763 |
| G033 | 52.59140 | 4.20345 | 581523 | 5827499 |
| G034 | 52.58896 | 4.21050 | 582005 | 5827235 |
| G035 | 52.58651 | 4.21756 | 582488 | 5826971 |
| G036 | 52.58406 | 4.22461 | 582970 | 5826707 |
| G037 | 52.58162 | 4.23166 | 583452 | 5826443 |
| G038 | 52.57917 | 4.23872 | 583935 | 5826179 |
| G039 | 52.57672 | 4.24576 | 584417 | 5825915 |
| G040 | 52.57427 | 4.25282 | 584900 | 5825651 |
| G041 | 52.59070 | 4.18879 | 580531 | 5827405 |
| G042 | 52.58834 | 4.19593 | 581019 | 5827150 |
| G043 | 52.58598 | 4.20305 | 581506 | 5826895 |
| G044 | 52.58361 | 4.21018 | 581993 | 5826640 |
| G045 | 52.58124 | 4.21731 | 582481 | 5826385 |
| G046 | 52.57888 | 4.22444 | 582968 | 5826130 |
| G047 | 52.57651 | 4.23156 | 583455 | 5825875 |
| G048 | 52.57414 | 4.23686 | 583942 | 5825620 |
| G049 | 52.57178 | 4.24581 | 584430 | 5825365 |
| G050 | 52.58529 | 4.18859 | 580527 | 5826802 |
| G051 | 52.58300 | 4.19579 | 581019 | 5826556 |
| G052 | 52.58072 | 4.20298 | 581511 | 5826310 |
| G053 | 52.57843 | 4.21017 | 582002 | 5826064 |
| G054 | 52.57615 | 4.21736 | 582494 | 5825818 |
| G055 | 52.57385 | 4.22456 | 582986 | 5825571 |
| G056 | 52.57156 | 4.23176 | 583478 | 5825325 |
| G057 | 52.58012 | 4.18874 | 580547 | 5826228 |
| G058 | 52.57791 | 4.19600 | 581043 | 5825990 |
| G059 | 52.57570 | 4.20326 | 581539 | 5825752 |
| G060 | 52.57349 | 4.21052 | 582035 | 5825515 |